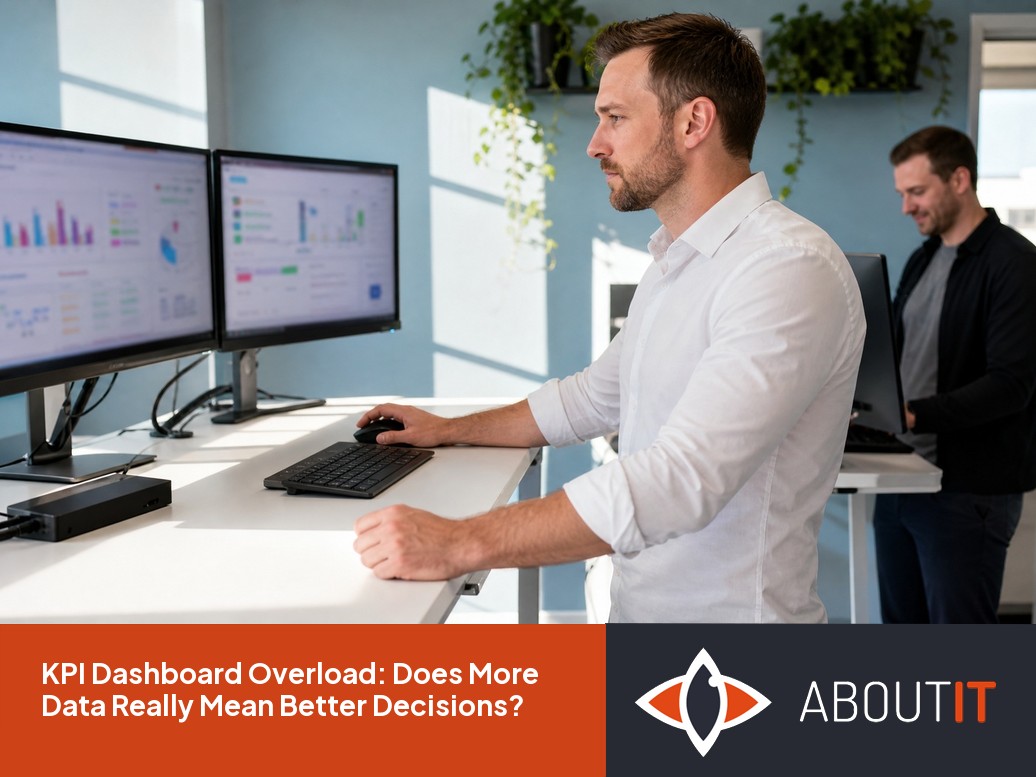
Packing a dashboard with more metrics often slows decisions instead of improving them. The most important number can get lost in the clutter, making meetings less effective and action harder to take.
Picture a Tuesday-morning meeting where someone pulls up the quarterly numbers, and the screen fills with forty tiles of charts before anyone has said a word. Ten minutes disappear before the group agrees on which number even matters today.
That scramble, repeated weekly, is what an overloaded KPI dashboard costs a business: not bad data, but wasted time and missed decisions.
The instinct to add more charts comes from a reasonable place, since a single sharp insight can move a team to act. But stack enough metrics around it and that same insight disappears into the noise, and the dashboard meant to guide the business ends up slowing it down instead.

When more metrics mean less clarity
Piling more data onto a business dashboard feels safe at first, since the logic runs: track everything, and nothing slips through. Yet that logic breaks down as the list of metrics grows, because clarity doesn't scale with it.
Every metric added competes for attention, and a crowded dashboard means a longer search for the one number that actually matters. Instead of speeding up decisions, it pulls teams into arguments about which figures deserve the focus in the first place.
That same overload breeds confusion once people start watching different numbers, since the shared sense of the main goal fades along with it. What follows is slower decision-making dressed up as more thorough analysis.
The hidden risk: Losing sight of your key performance indicator
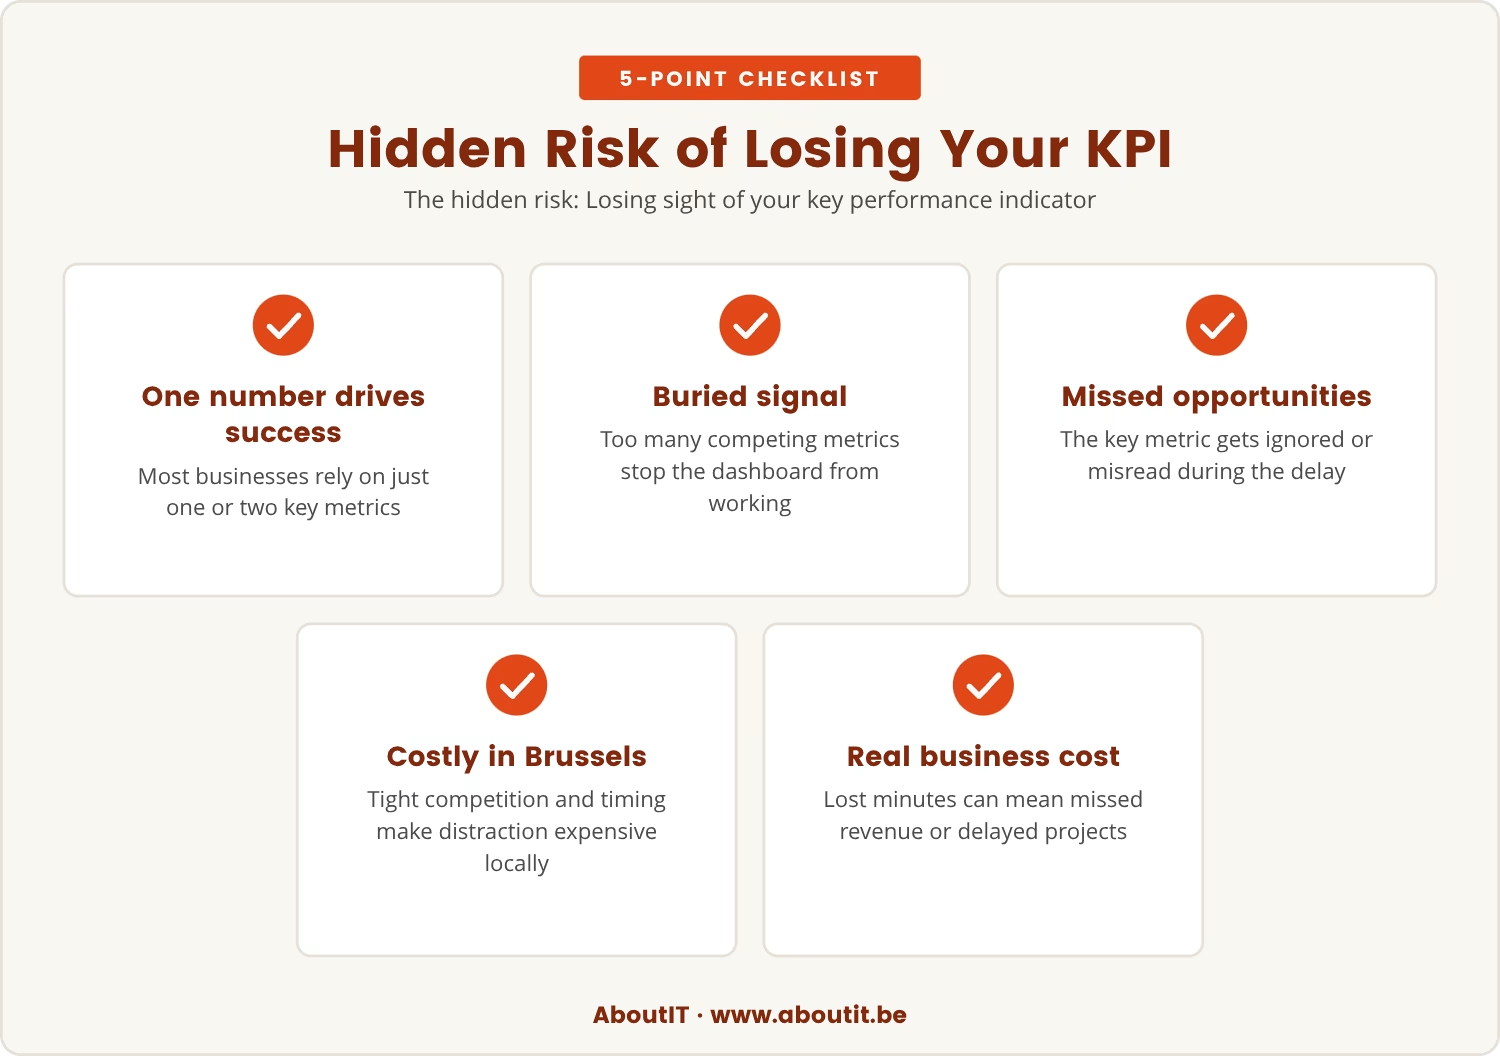
Behind the clutter sits a simpler truth: every business runs on one or two numbers that actually drive its success. Bury those inside dozens of competing metrics, and the dashboard stops doing its job.
Consider a team that spends the first ten minutes of every meeting just agreeing on which data to trust. That's ten minutes where opportunities go unnoticed, and the one metric that should set the next move gets ignored or misread instead.
In Brussels, where competition is tight and timing can decide a deal, that kind of distraction carries a real price tag. A few lost minutes in a meeting can turn into missed revenue or a project pushed back a week.
Why a KPI dashboard should focus on action
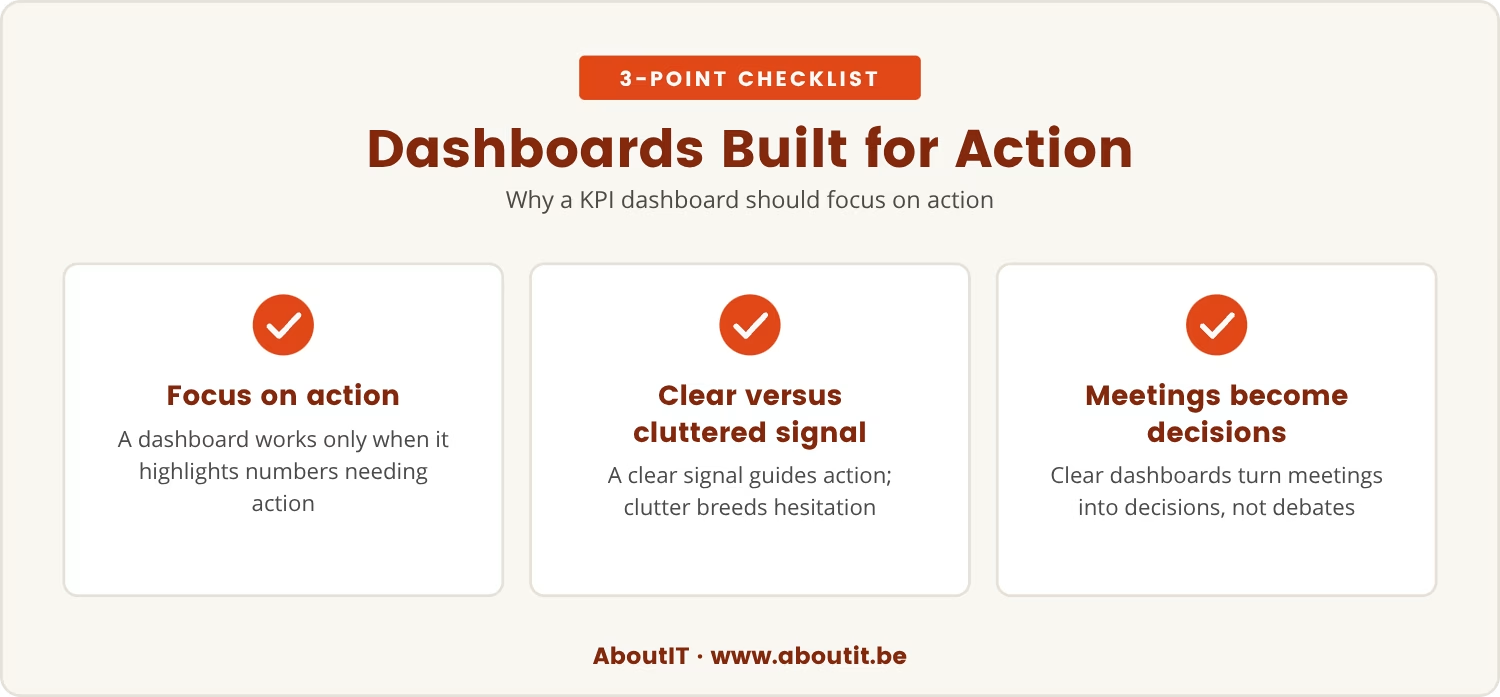
Given that risk, a KPI dashboard earns its keep only when it points straight at the numbers that call for action. A clear signal tells a team what to do next; a cluttered one invites hesitation and second-guessing.
Say the main goal is faster customer response times - that metric belongs front and center, with everything else supporting it rather than competing with it.
Built this way, dashboards turn meetings into decision sessions rather than debates, since everyone already knows where to look and what it means.
Common ways dashboards slow down decisions
Even well-intentioned dashboards drift toward clutter, and a few patterns show up again and again:
- Too many metrics: When every possible number is tracked, it's hard to know which one to act on.
- Unclear priorities: If the dashboard doesn't highlight what's most important, teams waste time deciding where to look.
- Data without context: Numbers alone don't tell the whole story, and without context they're easy to misread.
- Frequent changes: Constantly adding or removing metrics confuses users and disrupts routines.
- Lack of ownership: When no one owns keeping the dashboard focused, clutter builds up over time.
How to keep your business dashboard focused
Fixing that clutter starts with purpose: decide which metrics genuinely move the business forward, then limit the display to those and make them easy to find.
A useful test follows from there - if you could track only one metric this month, which would it be? That question cuts through the noise and points straight at what matters.
From that starting point, make review a habit. Pull out metrics that no longer serve the goal, and bring the team into that process so everyone agrees on what stays.
The role of SME reporting in decision-making
That same discipline matters most for small and medium-sized businesses, which often feel pressure to track everything. SME reporting tools make it simple to add more data, but simple isn't the same as useful.
Used well, those same tools are better aimed at trends and exceptions - the numbers that signal real change or demand action. That focus keeps a team aligned and its decisions timely, rather than buried in tracking for its own sake.
What happens when you simplify your metrics
Follow that discipline through, and the payoff shows up quickly: fewer metrics means more speed and more confidence. Teams know exactly where to look, and meetings stop circling the same questions.
Problems also surface earlier, because with fewer distractions the key performance indicator stands out instead of hiding in the crowd. That clarity is what turns into faster responses and, eventually, better results.
The point threading through all of it is simple: more data does not automatically mean better decisions. With dashboards, less is often what makes "more" possible.

How AboutIT helps teams focus on what matters
If you manage a business with 5 to 40 users, you might be facing a dashboard that feels more confusing than helpful. At AboutIT, we know how easy it is for key numbers to get lost in a sea of data.
We invite you to see how we help businesses cut through dashboard clutter and focus on the metrics that drive real action. Let’s talk about your setup and how we can make your data work for you.
Want a sharper view of your risk?
Get a Free Cyber Test (valued up to €5000) to see where your business stands and what threats might be hidden in your current setup.
Frequently asked questions
How do I decide which metrics to keep on my dashboard?
Identify the main goals driving the business, then choose metrics that directly measure progress toward them. Limit the dashboard to numbers that genuinely prompt action, and revisit that list regularly to confirm it still fits.
What is the risk of tracking too many KPIs?
Tracking too many KPIs breeds confusion and slows decision-making. Once a team can't agree on which numbers matter most, focus slips and real opportunities get missed.
Can real-time data help if my dashboard is already crowded?
Real-time data only helps when it's easy to interpret; on an overloaded dashboard, even up-to-the-minute figures turn into noise rather than insight. Simplify the dashboard first, then layer real-time updates onto the metrics that remain.
How often should I update or review my dashboard?
Review the dashboard at least once a quarter, dropping metrics that no longer apply and confirming that the key performance indicators still match current business goals. That rhythm keeps the dashboard useful instead of stale.
What is the best way to introduce a new metric without causing confusion?
Explain the new metric's purpose and how it supports the main objectives before adding it, so everyone understands why it's being tracked. Introduce it gradually and watch its impact before making it a permanent fixture.
.jpg)